What is break-even analysis and how does it affect pricing decisions?

Navigating the complexities of financial decision-making requires precise tools to uncover the balance between costs and revenues. Break-even analysis stands as a vital instrument in this quest, offering clarity on the point where business activities shift from loss to profit. By understanding this critical threshold, financial professionals can craft pricing strategies that cover expenses and maximize profitability. This article delves into the core of break-even analysis, revealing its profound influence on pricing decisions that drive sustainable business growth.
What is Break-even Analysis?
Break-even analysis is a fundamental financial technique used to determine the level of sales at which total revenues equal total costs, resulting in neither profit nor loss. This critical point, known as the break-even point, serves as a benchmark for evaluating the viability of a product, project, or business. By identifying this threshold, companies gain insight into the minimum performance required to avoid losses and begin generating profit. This analytical approach authorizes decision-makers with a clear understanding of cost behavior and sales targets, essential for effective financial planning.
Components of Break-even Analysis
Break-even analysis relies on understanding three key financial elements: fixed costs, variable costs, and the contribution margin. Fixed costs are expenses that remain constant regardless of production volume, such as rent, salaries, and insurance. Variable costs fluctuate directly with the output level; examples include raw materials and direct labor. The contribution margin, defined as sales revenue minus variable costs, represents the amount available to cover fixed costs and contribute to profit. Mastery of these components allows businesses to calculate the break-even point accurately and make informed financial decisions.
Calculating the Break-even Point — Formula and Interpretation
The break-even point marks the exact sales volume at which total revenue matches total costs, meaning the business neither gains nor loses money. Calculating this point involves a straightforward formula:
Break-even Point (units)=
Break-even Point (units)=
Fixed Costs _________________________________________________
Selling Price per Unit−Variable Cost per Unit
This formula identifies the number of units that must be sold to cover all expenses. Understanding this figure allows financial professionals to set realistic sales targets and price products appropriately. Beyond the formula, interpreting the break-even point provides insight into the financial health of a product line, enabling strategic adjustments in production and marketing efforts to achieve profitability.
To illustrate break-even analysis, take an example:
To illustrate break-even analysis, take an example:
Consider a company manufacturing electronic gadgets. Suppose fixed costs amount to $50,000 monthly, the selling price per unit is $100, and the variable cost per unit is $60. Applying the formula: Break-even Point = 50,000 ÷ (100−60)
= 50,000 ÷ 40 = 1,250 units
This means the company must sell at least 1,250 units monthly to avoid losses. Selling fewer units results in a deficit, while exceeding this volume leads to profit. Such calculations guide pricing adjustments, production planning, and financial forecasting. Additionally, analyzing multiple pricing scenarios with their corresponding break-even points helps companies choose strategies that align with market demand and cost structure.
Also Read: A Comprehensive Guide to Cost Management and Decision Making.
How Break-even Analysis Influences Pricing Decisions
Pricing is not merely a marketing choice; it’s a financial decision deeply rooted in cost structure and profitability goals. Break-even analysis plays a pivotal role in shaping pricing strategies by revealing the minimum price at which a product can be sold without incurring a loss.
For instance, if a product’s variable cost is $60, and the business aims to break even after covering $50,000 in fixed costs, the selling price must be high enough to generate a sufficient contribution margin. If the market does not support the required price point, businesses may reconsider product features, packaging, or even launch a product feasibility.
For instance, if a product’s variable cost is $60, and the business aims to break even after covering $50,000 in fixed costs, the selling price must be high enough to generate a sufficient contribution margin. If the market does not support the required price point, businesses may reconsider product features, packaging, or even launch a product feasibility.
This analytical approach ensures that pricing decisions are grounded in financial reality rather than guesswork. It protects against underpricing, which erodes margins, and helps assess whether potential pricing scenarios can support sustainability and growth.
Strategic Pricing Decisions Using Break-even Analysis
Break-even analysis provides a financial backbone to several common pricing strategies by quantifying how cost structure and sales volume impact profitability. These strategies may vary across industries, but all benefit from break-even analysis as a tool for validating assumptions and adjusting to market realities. Here are three widely used pricing models where break-even insights are essential:
- Cost-Plus Pricing This approach sets prices by adding a markup to the total cost of the product. Break-even analysis helps ensure the markup is sufficient to cover fixed costs and generate a profit. It also tests the feasibility of the price to the expected sales volume.
- Penetration Pricing This strategy is used to enter competitive markets and involves setting a lower price to attract customers quickly. Break-even analysis assesses how long the company can operate below optimal margins before reaching sustainability, and identifies the sales volume required to compensate for lower unit profitability.
- Premium Pricing In high-end markets, businesses often price products significantly above cost to reflect brand value or perceived quality. Break-even analysis ensures that even with lower volumes, the pricing model still supports fixed costs and achieves profitability within a targeted timeframe.
Assumptions and Real-world Challenges of Break-even Analysis
While break-even analysis is a powerful tool for pricing and planning, it comes with important limitations that must be acknowledged for informed decision-making. To use break-even analysis effectively, financial professionals must complement it with market research, forecasting tools, and scenario planning. The most important of these challenges and hypotheses are:
- Simplified Assumptions Break-even analysis assumes that fixed and variable costs remain constant and that every unit is sold at a consistent price. In practice, discounts, bulk pricing, and fluctuating input costs can distort these assumptions.
- No Margin for Market Dynamics The model doesn’t account for market behavior, such as changes in demand, competitor pricing, or economic conditions. It offers internal cost visibility, but not external market adaptability.
- Single-Product Focus Break-even analysis typically evaluates one product or service at a time. This isolation can lead to oversimplified conclusions for companies with multiple offerings or shared resources.
- Static View of Costs and Sales It provides a snapshot rather than a dynamic picture. Costs may change with scale, and sales patterns may shift based on seasonality, marketing campaigns, or new competition.
Enhancing Break-even Analysis with Technology
Modern financial decision-making increasingly depends on real-time data and automation. Technology transforms break-even analysis from a static calculation into a dynamic tool that updates as conditions change. Advanced accounting platforms like Wafeq Provide finance professionals with the insights and agility needed for smarter pricing decisions.
How does Wafeq support break-even Analysis?
Incorporating Wafeq into the break-even process reduces manual effort, minimizes error, and enhances accuracy, empowering finance professionals to anticipate risks, refine pricing strategies, and sustain profitability in competitive environments.
- Real-time Cost Tracking Wafeq allows for continuous tracking of both fixed and variable costs through automated accounting entries. This real-time visibility ensures that break-even calculations reflect current financial conditions, not outdated estimates.
- Product-level Profitability Insights Through itemized reports and margin analysis, Wafeq enables users to assess the contribution margin of each product or service. This granular view is crucial for calculating accurate break-even points for each offering.
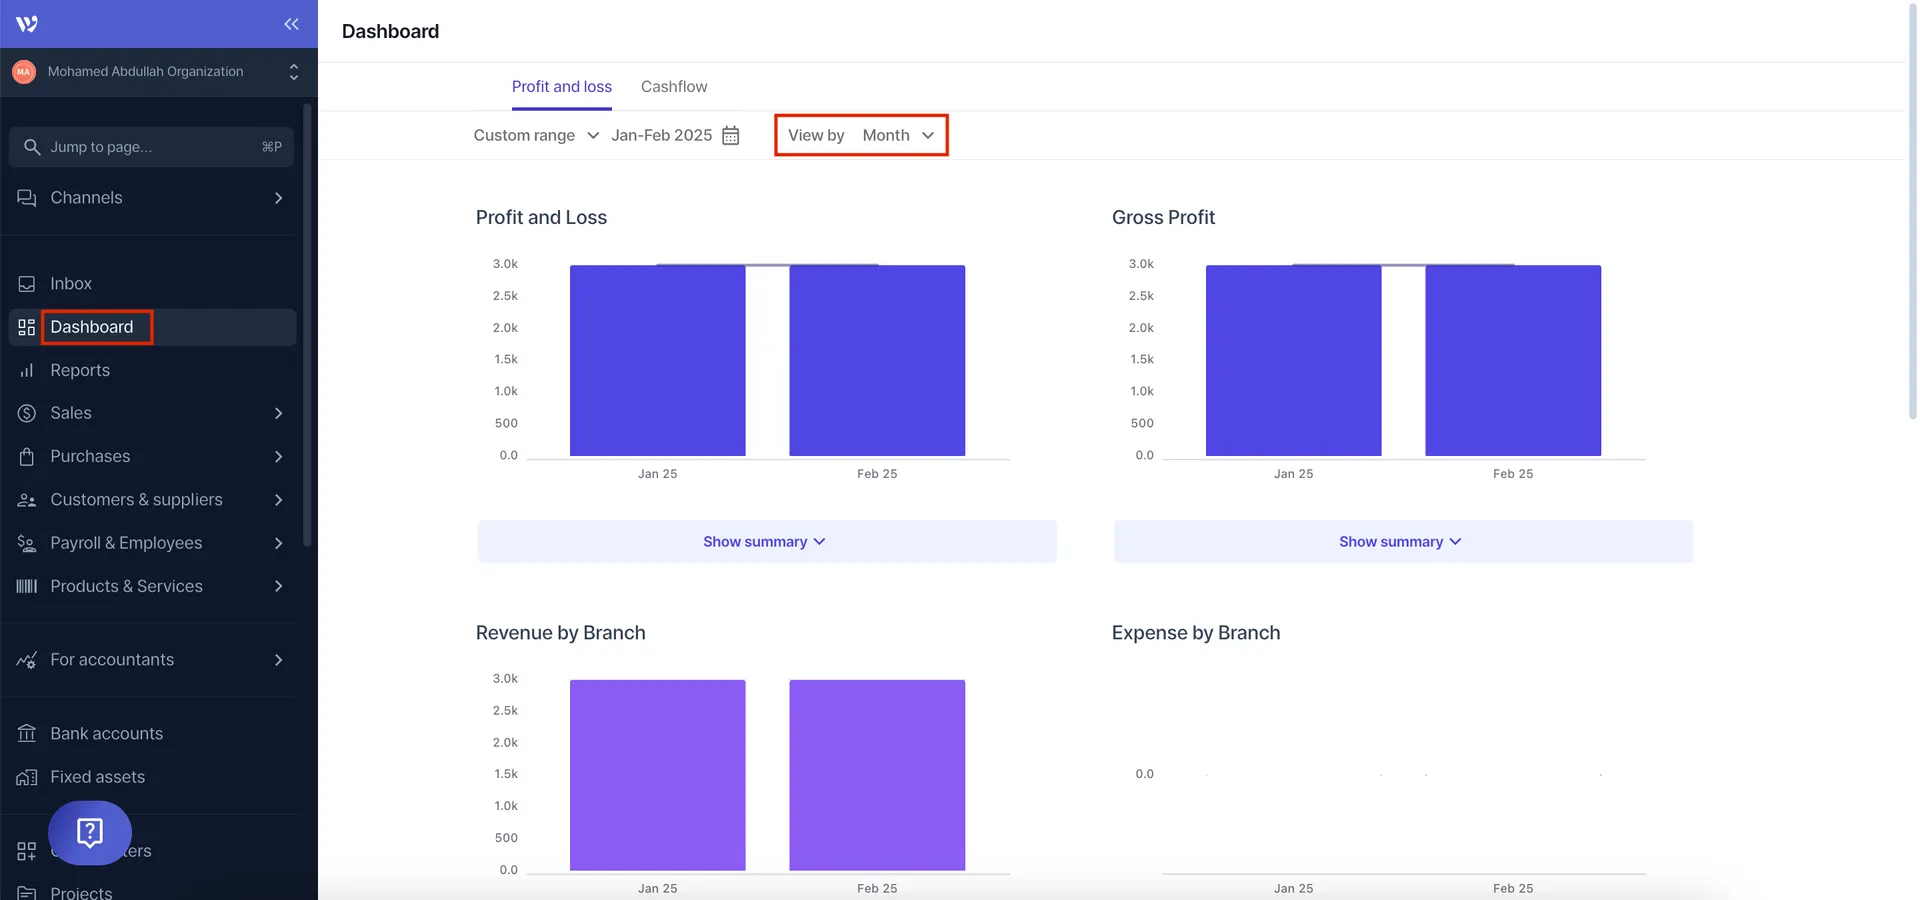
- Custom Reporting and Dashboards Finance teams can build tailored dashboards in Wafeq to monitor break-even performance, simulate pricing changes, or test cost scenarios. These visualizations facilitate rapid, data-driven decision-making.
- Integration with Sales and Inventory By integrating sales records and inventory costs, Wafeq provides a comprehensive view of financial performance. Users can track sales volumes against fixed and variable costs, allowing automatic updates of break-even thresholds.
- Multi-branch and Multi-currency Support Wafeq accommodates multiple currencies and business units, enabling localized break-even analysis without the need for external consolidation tools.

Break-even analysis is considered a strategic compass that guides pricing, cost control, and growth planning. For financial professionals, mastering this tool means gaining clarity to make decisions that align with both short-term performance and long-term viability.
By identifying the precise point where cost equals revenue, businesses can:
- Set profitable and competitive pricing structures.
- Adjust cost components to improve margins.
- Plan for expansion with realistic revenue goals.
- Avoid underpricing that erodes profitability.
- Communicate financial goals clearly across departments.
Technology, particularly tools as Wafeq, elevates break-even analysis from manual spreadsheets to real-time, scenario-based decision-making. Live financial data integration, custom reporting, and product-level insights help finance teams turn static analysis into a living sample, always aligned with the business environment.
In an economy where agility is currency, break-even analysis extends businesses with the financial precision to price smartly, grow sustainably, and operate confidently.
Also Read: What is Profit Margin? Understanding Types and Top Strategies to Improve It for Your Business
FQAs about break-even analysis
What is break-even pricing?
Break-even pricing is a strategy in which the product is priced exactly at the level needed to cover its total costs, fixed and variable, without generating a profit or a loss. This approach is commonly used to enter new markets, gain market share, or test new products while minimizing financial risk.
How do you calculate the break-even point for multiple products?
When a business sells multiple products, the break-even point must consider any product's sales mix, that is, the relative proportion of each product sold. You calculate the weighted average contribution margin across all products and then divide total fixed costs by that margin. It’s a more complex analysis, but it provides a realistic break-even estimate for a diverse portfolio.
How does break-even analysis support decision-making?
Break-even analysis guides key decisions in pricing, budgeting, and capacity planning. It allows managers to make informed decisions that align with cost structure and profit expectations, as it helps answer questions like:
- Is the current pricing strategy sustainable?
- What sales volume is required to avoid losses?
- Should we launch a new product or expand operations?
What is the contribution margin at the break-even point?
The total contribution margin equals the total fixed costs at the break-even point. This means that the per-unit contribution margin (selling price minus variable cost per unit) multiplied by the number of units sold precisely covers the fixed costs, without leaving any profit or loss.
Use Wafeq to calculate your break-even point with real-time cost and sales data, no spreadsheets, no guesswork.
Use Wafeq to calculate your break-even point with real-time cost and sales data, no spreadsheets, no guesswork.


.png?alt=media)


